Home
About Us
Introduction
Our History
Our Mission
Founder and Honorary Chairman
Board of Directors
Management Team
Group Businesses
Awards
Our Business
Business Overview
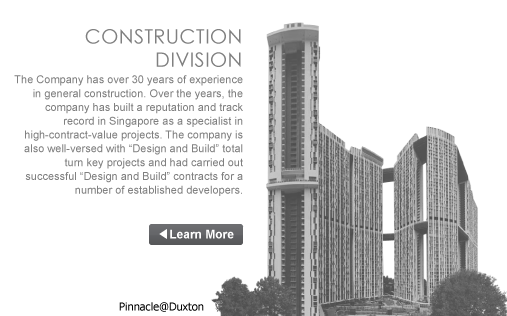
Construction
Construction Mission
Current Projects
Completed Projects
Corporate Policy
Pre-cast Technology
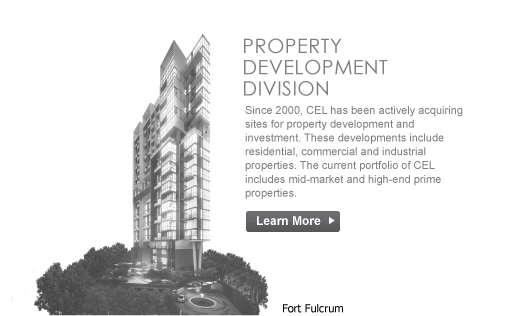
Property Development and Investment
Investor Relations
Corporate Information
Financial Highlights
Factsheet
Announcements
Annual Reports
Sustainability Reports
Analyst Reports
Email Alerts
Contact Us